Introduction
Over the past decade, Faulkner University has demonstrated a growing commitment to meeting its assessment needs. In recent years, the Institution has focused on conducting regular meta-assessments to ensure continuous improvement. Faulkner has explored innovative approaches to assessing student achievement with the intent to enhance the educational experience for students and drive the university’s ongoing development. This data reflects the most current iteration of assessment, the 2023-2024 academic year and prior, as the outcome indicates.
SACSCOC Compliance
SACSCOC Standard 8.1 states: “The institution identifies, evaluates, and publishes goals and outcomes for student achievement appropriate to the institution’s mission, the nature of the students it serves, and the kinds of programs offered. The institution uses multiple measures to document student success.” In compliance with this standard, Faulkner has honed its student achievement assessment process and has identified five primary goals and outcomes to assess student achievement. These outcomes were selected based on research into industry standards and a thorough benchmarking process that examined the practices of other institutions for tracking student achievement. As part of this assessment, one of the primary objectives is to allow prospective students to compare and contrast institutions, enabling them to choose the best fit for their needs, particularly an institution that will best support their success. To this end, as much as possible, Faulkner has striven to align its outcomes with those of other institutions. The five key outcomes identified are:
- Course Success
- Graduation Rates and Number of Degrees Awarded
- Retention Rates
- Licensure and Certification Obtained
- Graduate Tracking
A comprehensive narrative describing the multiple measures used to document student success and the thresholds of acceptability for each outcome, including the appropriateness to the Institution’s mission, the appropriateness to the nature of the students it serves, and the appropriateness to the programs offered, follows.
Disaggregation by Population
Faulkner serves a diverse population of students, holding the unique distinction of being both a Predominantly Black Institution (PBI) and a Primarily White Institution (PWI). Given this diversity, while disaggregation of the data by race is undoubtedly significant, disaggregation by ethnicity may be less statistically significant. Data has already been collected for the upcoming IPEDS submission for 2024, which was due on April 1, 2025. The current enrollment ratio of male to female students is 42% male to 58% female, reflecting a notable imbalance between the genders, which must be considered when evaluating achievement across these populations. It is important to note that Faulkner University has chosen to identify only male and female students in its IPEDS reporting and within its student information system. Therefore, only these two categories will be analyzed. Pell/Non-Pell status has also been included, and these numbers are examined for each area.
Faulkner’s Measures to Document Student Success:
1. Course Success
At Faulkner University, course success is defined as passing a course with a grade of A, B, C, D, or P. While final grades are not typically used as direct assessments for individual courses or programs, as they represent an indirect measure of student achievement, tracking course success rates offers a valuable overview of overall institutional performance. Additionally, course success is a key indicator of students’ likelihood to persist and graduate, as higher course pass rates correlate with increased retention and graduation rates. This is why course success is assessed before evaluating graduation and retention rates, providing essential context for understanding these broader outcomes. The University employs various assessment methods within each course, including formative and summative assessments and direct and indirect measures. These comprehensive evaluations ensure a robust understanding of students’ specific skills and knowledge acquisition.
Student Achievement Outcome and Threshold of Acceptability: Using the Institution’s standard threshold of acceptability of 85%, all courses will achieve a success rate (grades A, B, C, D, or P) of 85% (the percentage of students who achieve these grades within these courses).
Outcome Results and Discussion of Data Documentation:
Disaggregation by Gender
![]()
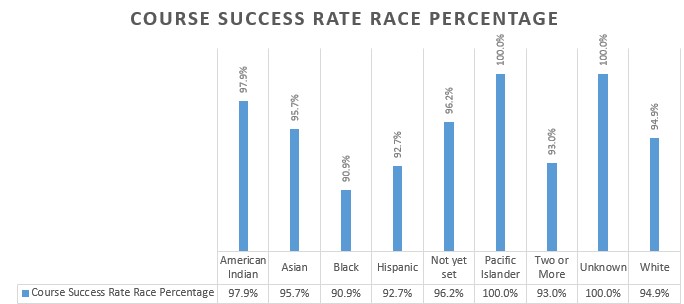
Disaggregation by Race
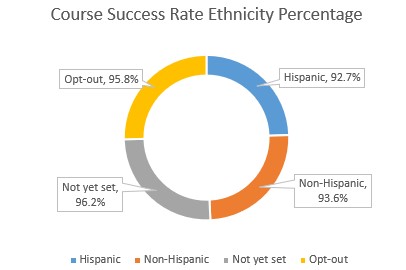
Disaggregation by Ethnicity
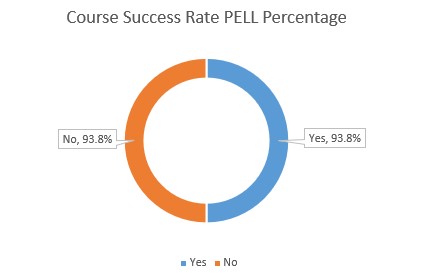
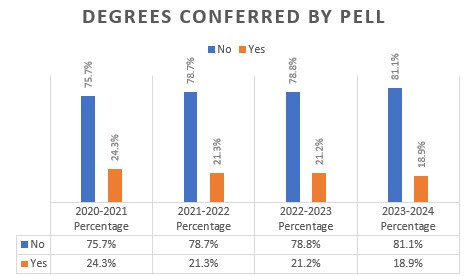
Disaggregation by Pell1
Continuous Improvement and Closing the Loop: Overall, course success rates remain consistent with previous academic years. However, a review of the data reveals that graduate and undergraduate courses in the V.P. Black College of Biblical Studies fall below the acceptable threshold. Despite this, the University-wide completion rate remains favorable. Colleges within the Institution can use overall course success data to assess student performance in comparison to other colleges.
When disaggregated by population, the most concerning trend is the lower success rate among Pell Grant recipients. Additionally, females perform slightly better than males, and white students outperform other racial groups—an outcome largely reflective of the University’s predominantly White and Black student population and higher percentage of female enrollment. Given these disparities, the University plans to further analyze data on Pell Grant recipients to identify strategies for improving their academic performance.
It is important to note that the University is not solely aiming for high levels of achievement, but rather a distribution that reflects a bell-curve representation of student outcomes. In programs where course success rates are notably high, such as the Jones School of Law and the College of Health Sciences graduate programs, this is primarily due to program requirements that mandate passing grades for progression. In these cases, students who struggle academically are placed in remediation before the course concludes, ensuring they receive the necessary support to achieve a passing grade.
2. Graduation Rates and Number of Degrees Awarded
This outcome represents the sole outcome identified by SACSCOC as a required measure of student achievement. Several years ago, SACSCOC required institutions to select a 4-year, 6-year, or 8-year graduation rate of First-Time, Full-Time (FTFT) Students as their standard graduation rate measurement. After evaluating multiple years of cohort data, Faulkner selected the 6-year graduation rate (GR 150% in IPEDS) as the standard measure. The rationale behind choosing the 6-year rate stems from many of Faulkner’s graduates not completing their degree within four years. The distinction between the 6-year and 8-year rates is minimal, as students generally do not persist beyond the eight-year mark without earning their degree.
Graduation rates are crucial for several reasons. Firstly, graduation typically signifies the mastery of the student learning outcomes defined by the program. Graduates have completed all required coursework, including core and program-specific courses, and should have acquired the necessary knowledge, skills, and dispositions expected of graduates from that program.
The speed at which they achieve these outcomes reflects their proficiency. For example, students who graduate within four years typically demonstrate the ability to pass all courses on their first attempt and maintain a course load conducive to timely completion. Since most degree programs require 120 credit hours or more, a student must enroll in more credit hours each semester, including possibly taking summer courses, to complete the program in four years. Even at this pace, completing the degree in five years is common. A student graduating within six years is generally considered to have received some flexibility in their academic journey while still obtaining their degree within a reasonable timeframe.
Students who graduate on time are generally more prepared for the workforce, often called career readiness, than those who take longer or do not complete a degree. Additionally, timely graduation benefits the economy by facilitating a quicker entry into the workforce, allowing graduates to start earning sooner and cease paying tuition and fees. A college degree is increasingly essential for upward mobility, as graduates tend to earn higher wages, commit fewer crimes, experience better overall health, and contribute more positively to their communities and society.
For institutions, tracking graduation rates serves as a measure of program effectiveness. Programs with lower graduation rates may face challenges such as an overly rigorous curriculum (e.g., programs designed for a master’s level but offered at the baccalaureate level) or insufficient quality in teaching and educational resources. There may also be a need to assess the institution's support services and overall learning environment. Furthermore, as discussed in a subsequent section, disaggregating graduation data by demographic factors (e.g., gender, race, ethnicity, and Pell Grant status) can highlight disparities among student groups and indicate which areas must be addressed.
In tandem with graduation rates, the number of degrees awarded provides additional insight. While graduation rates reflect the proportion of students who complete their degrees, the number of degrees awarded illustrates how productive a program is and at what academic levels the majority of degrees are granted. This information can guide prospective students in selecting programs more likely to lead to graduation. It also allows institutions to benchmark their programs against others, assessing the relative success in producing graduates. Furthermore, tracking degrees awarded offers valuable insight into program demand and relevance, shedding light on how popular and valued a program is in the job market.
Student Achievement Outcome and Threshold of Acceptability: In alignment with its ongoing student retention efforts, Faulkner University has established a goal of achieving annual and consecutive gains in its six-year FTFT graduation rates compared to prior years internal to the Institution. The threshold of acceptability for the First-Time, Full-Time (FTFT) population has been set at 30%, a target determined by the Director of the Center for Assessment, Research, Effectiveness, and Enhancement (CAREE) after a comprehensive review of prior years’ data. Over the past five years, FTFT graduation rates were recorded at 25%, 28%, 24%, 23%, and 26% annually. The 30% threshold was designed as a strategic objective to elevate the FTFT graduation rate above this benchmark.
In 2018, this goal was met and exceeded, reflecting the institution’s focused efforts toward student success. Building on this progress, Faulkner University is considering a 6-year FTFT graduation rate benchmark of 40% by 2028.
It is important to note these graduation rates solely represent FTFT students. If the calculation were expanded to include the entire student body, including graduate and executive program students, the rates would average approximately 20% higher. However, the University has intentionally prioritized FTFT graduation rates as this is a widely recognized benchmark and an area identified for significant improvement.
Regarding degrees awarded, Faulkner uses the Alabama Commission on Higher Education’s publication of Alabama Public Institutions Degrees Awarded to gauge its success compared to analogous schools. For this most recent report, Faulkner compared itself to Auburn University Montgomery (AUM), as it is the closest in distance and similar in enrollment/demographics and offerings to Faulkner. The average number of degrees awarded by AUM across all levels for the past five years is 1,129, which Faulkner has selected as its threshold of acceptability.
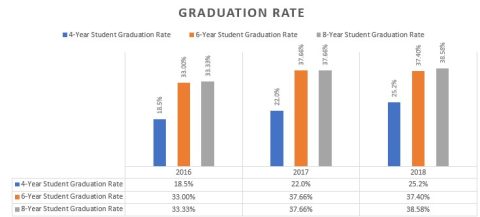
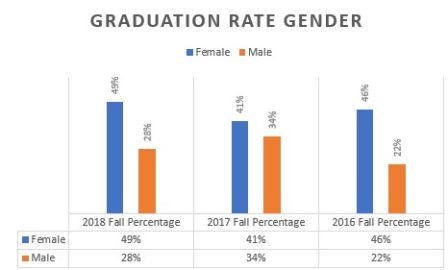
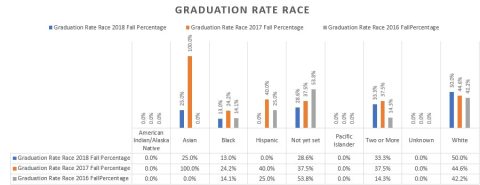
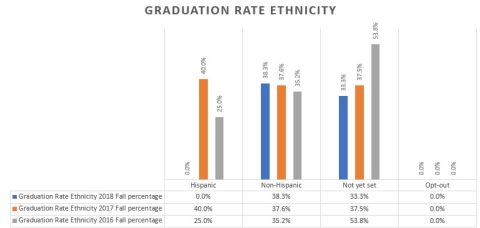
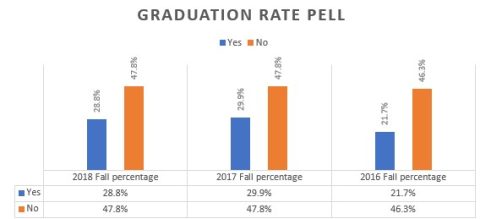
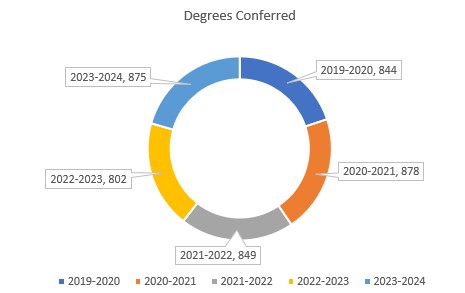
Outcome Results and Discussion of Data Documentation: The following graphical representations demonstrate both the overall graduation rates and the disaggregated data by gender, race, ethnicity, and Pell/Non-Pell status:
Disaggregation by Gender
Disaggregation by Race
Disaggregation by Ethnicity
Disaggregation by Pell/Non-Pell Status2
Number of Degrees Awarded
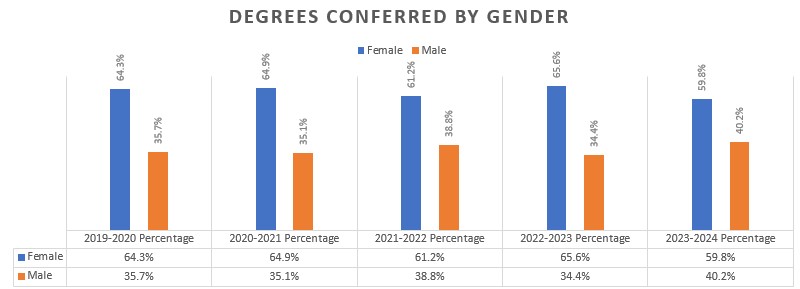
Disaggregation by Gender
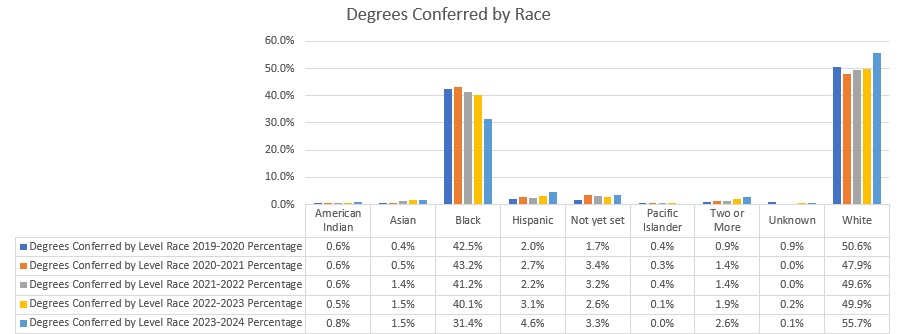
Disaggregation by Race
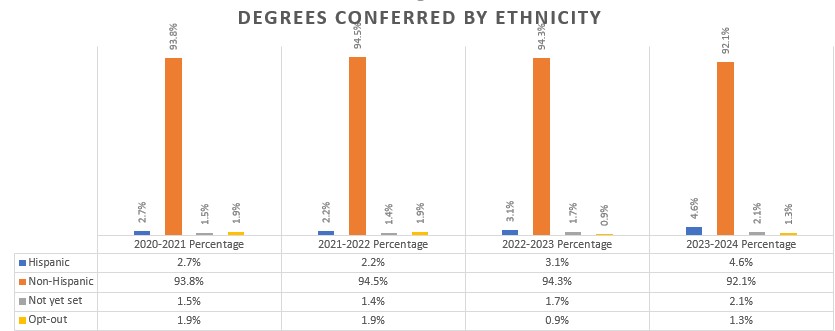
Disaggregation by Ethnicity
Disaggregation by Pell/Non-Pell Status
Continuous Improvement and Closing the Loop: As already indicated, the difference between the 4-year and 6-year FTFT graduation rates for the entire Institution is statistically significant, but the difference between 6-year and 8-year rates is not. The rates between males and females are disproportionate, with females having significantly higher graduation rates. The rates amongst the various races are disproportionately higher for white students. Still, it should be noted that, in the FTFT category, the white population is higher than the other races. It is in the non-traditional and graduate students that these numbers change. When disaggregated by ethnicity, non-Hispanic rates are much higher than Hispanic rates. When disaggregated by Pell/Non-Pell status, the graduation rate is almost double for Non-Pell vs. Pell students.
It is clear Faulkner needs to spend time addressing these populations. However, it should be noted that white students are a higher percentage of the FTFT population. Regardless, while the overall FTFT graduation rate has increased significantly and even exceeded the threshold of acceptability, it is clear that much attention needs to be paid to improving the disparities of graduation rates when the data is disaggregated. The Institution has set the following thresholds of acceptability for improvement by 2028:
- Increase the overall 6-year FTFT graduation rate to 40%.
- Increase the number of disaggregated populations with significant disparities by 5% each.
3. Retention Rates
Retention is a key indicator of institutional and student success, widely used by colleges and universities to assess student performance and institutional support effectiveness. Similar to graduation rates, if students are retained, they achieve the thresholds of acceptability set for their educational programs. It also means they are engaged with and plugged into the Institution.
Strong retention rates indicate students receive the necessary services and programming tailored to their needs. While many factors influencing graduation rates also apply to retention, a key distinction exists between the two. Graduation rates can include transfer students who complete only the necessary credits to earn a degree from Faulkner. In contrast, retention measures the institution’s ability to sustain student enrollment from term to term or year to year without losing students to other institutions or the workforce.
Faulkner considers retention a fundamental measure of institutional success, as high retention rates reflect student satisfaction and institutional effectiveness. Like graduation rates, retention serves as a critical metric for evaluating student persistence and engagement, institutional effectiveness, graduation forecast, financial stability of the institution, student support effectiveness, and student life culture.
Appropriateness to the Institution’s mission: Similar to graduation rates, this outcome aligns closely with Faulkner University’s mission, reflecting its commitment to fostering the development of well-rounded, educated individuals. Beyond academic achievement, the Institution strongly emphasizes providing “a caring Christian environment where every individual matters every day.” While academic success is undoubtedly a key factor in student retention, Faulkner believes its core dedication to cultivating a positive, nurturing atmosphere is equally essential.
Intentional and personalized student support, tailored to meet the unique needs of each individual, is a fundamental aspect of the University’s approach. This commitment ensures students’ progress academically and feel valued and supported throughout their educational journey. By providing a safe and encouraging environment, Faulkner enhances student success and strengthens retention, further exemplifying its mission.
Student Achievement Outcome and Threshold of Acceptability: In conjunction with the University’s consultant for retention efforts, Credo, the threshold of acceptability has been set at an increase of 1% retention per year. While the number may be small, this is a difficult needle to move, even by a fraction of a percentage. The University has invested significant time and effort into achieving higher retention rates, which is one of the primary measures of student success.
Outcome Results and Discussion of Data Documentation:
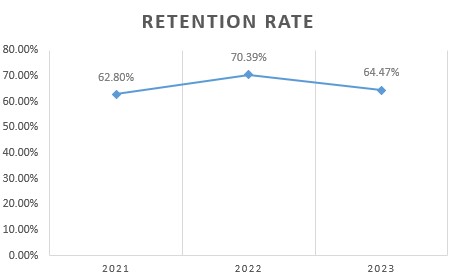
Overall Retention Rates
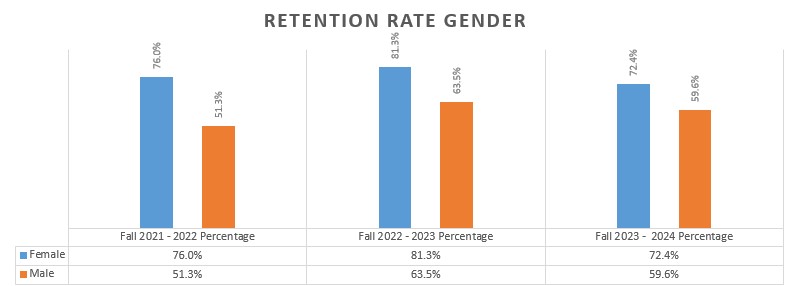
Disaggregation by Gender
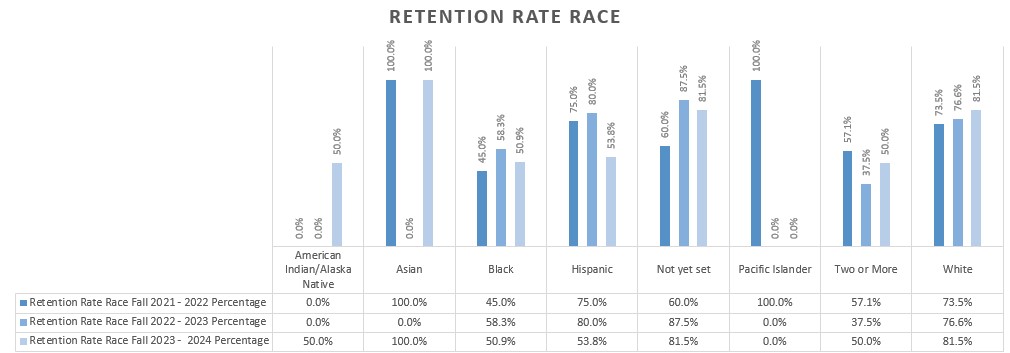
Disaggregation by Race
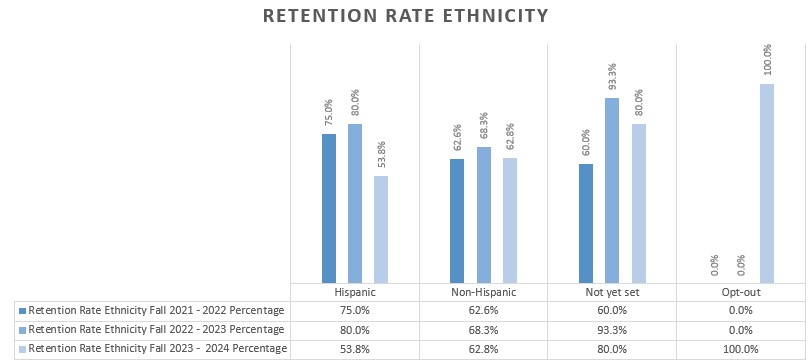
Disaggregation by Ethnicity
Disaggregation by Pell/Non-Pell Status3
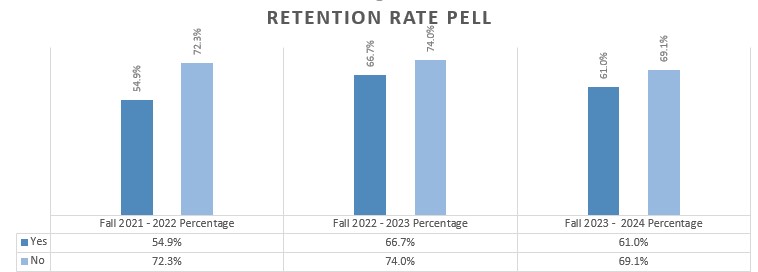
An in-depth data analysis reveals significant fluctuations in overall retention rates over the past four years. Male students have demonstrated higher retention rates than females, while Black students have shown more consistent retention patterns. Although retention among Pell Grant recipients has historically been lower, recent data indicates an upward trend, likely due to increased institutional focus on supporting this group.
Continuous Improvement and Closing the Loop: While it remains challenging to determine the extent to which retention fluctuations are influenced by lingering effects of COVID-19 and institutional characteristics, the University’s Retention Task Force is actively working to identify and address any observable barriers. Notably, the introduction of two PBI grants in 2021 has provided increased support for Pell Grant recipients and Black students—an essential focus already yielding positive results.
4. Licensure and Certification Obtained
Explanation and justification of outcome: Tracking licensure and certification is a key measure of student achievement across multiple domains. It is important to note not all programs lead to licensure and/or certification. However, for those who do, successful attainment signifies several critical benchmarks, including the validation of skills and competencies, professional readiness, student motivation, and the achievement of student learning outcomes. Additionally, for academic programs, licensure and certification rates provide insight into how well the curriculum aligns with industry standards.
Verifying skills and competencies is particularly significant, as obtaining licensure or certification typically requires passing a standardized exam. These assessments serve as direct measures of student learning within a given field, focusing on the essential knowledge, skills, and professional dispositions required for success. Unlike traditional coursework, licensure and certification exams often demand extensive independent preparation and self-discipline, making them a strong indicator of a student’s motivation and commitment to meeting industry standards.
From an institutional perspective, licensure and certification outcomes offer valuable data on program effectiveness and alignment with industry expectations. A high student success rate on these standardized exams suggests the institution’s programs are competitive with peer institutions. Strong performance indicates students meet or exceed national professional competency standards since these exams are typically measured against consistent benchmarks across the field.
Student Achievement Outcome and Threshold of Acceptability: Within each program that leads to obtaining licensure and/or certification, the thresholds of acceptability will be met per program. Note that each program will have a different threshold of acceptability, so the University is deferring to programmatic standards rather than creating an overarching threshold of acceptability. The following is a list of programs offered at Faulkner University that lead to licensure/certification and the threshold of acceptability for each program. Note that when disaggregating this data, no Pell/Non-Pell disaggregation is done because all programs included in this outcome are at the graduate level and graduate-level students are not awarded Pell grants.
- College of Education- Note: All students within the College of Education must meet the Threshold of Acceptability and passage rates to obtain licensure, as it is a requirement for graduation from the program. This does not include first-time passage rates, but passage rates as a whole. Therefore, no further data is required. This excludes the two counseling programs, as licensure is not required, and there is no threshold of acceptability for these programs.
- B.S. in Elementary Education- 100% passage rate
- B.S. in Physical Education- 100% passage rate
- B.S. in Social Sciences with Secondary Education- 100% passage rate
- B.S. in English with Secondary Education- 100% passage rate
- B.A. in Music Education, Instrumental- 100% passage rate
- B.S. in Music Education, Choral- 100% passage rate
- M.Ed. in Elementary Education, Alternative A- 100% passage rate
- M.Ed. in Social Science with Secondary Education, Alternative A- 100% passage rate
- M.Ed. in English with Secondary Education, Alternative A- 100% passage rate
- M.Ed. in School Counseling- no passage threshold of acceptability currently set because licensure/certification is not mandatory in all states.
- M.Ed. in Clinical Mental Health Counseling- no passage threshold of acceptability currently set because licensure/certification is not mandatory in all states.
- College of Health Sciences
- M.A./M.S. in Speech-Language Pathology- 85% passage rate within one year
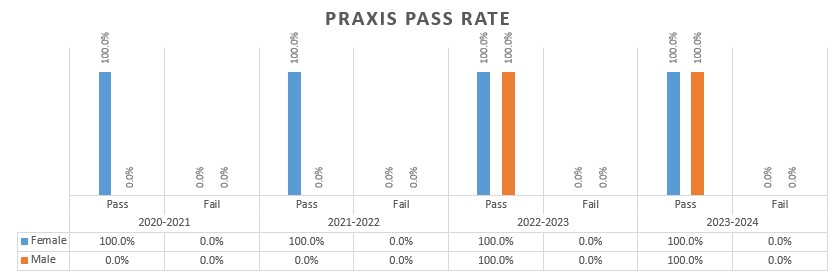
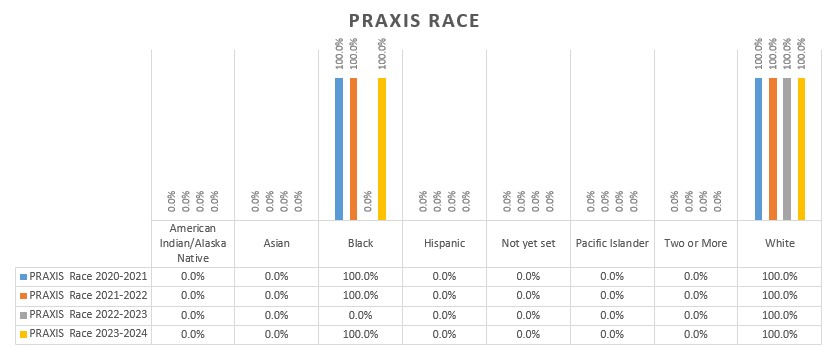
- Praxis Exam Passage Rates:
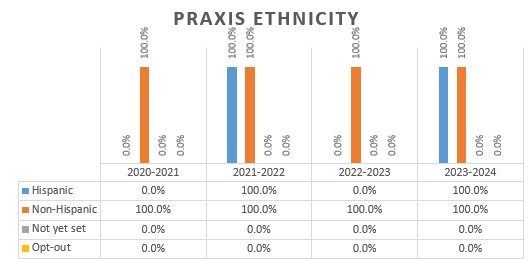
- M.S. in Physician Assistant Studies- 85% first-time passage rate
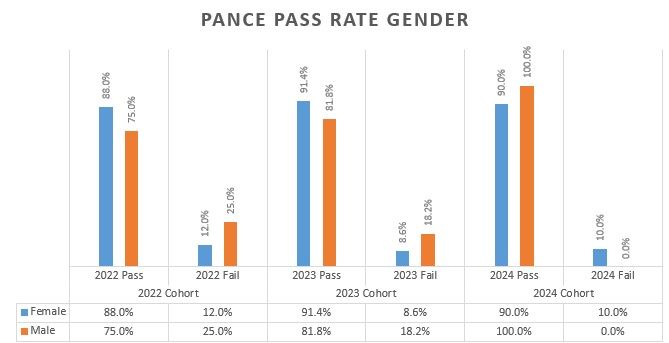
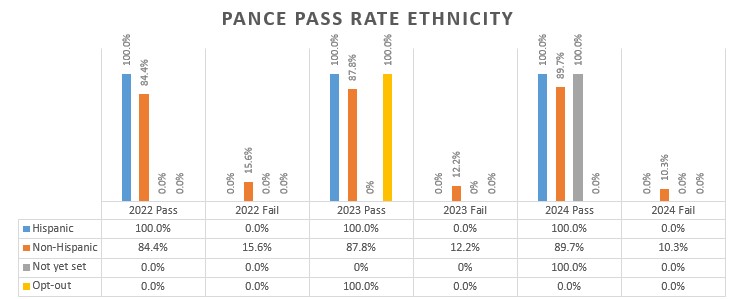
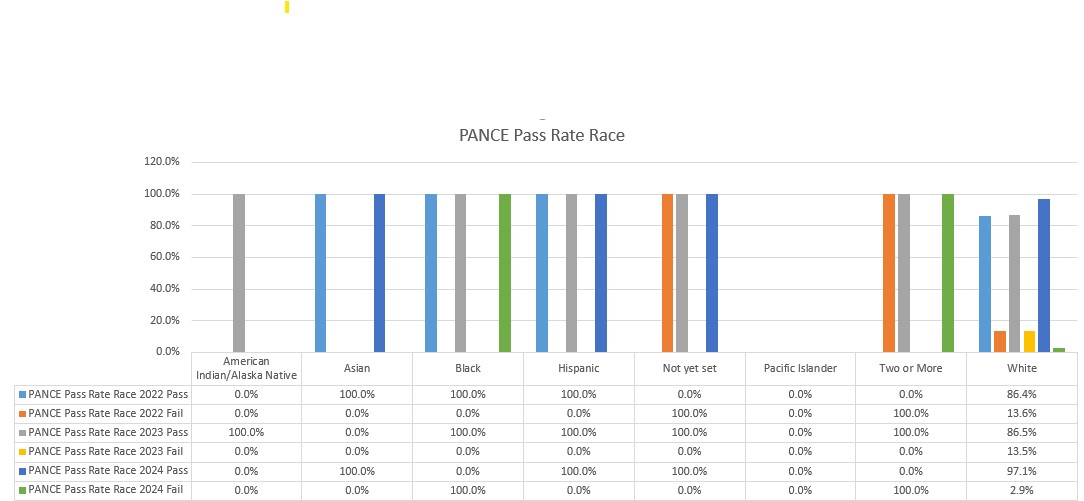
- PANCE Passage Rates:
- Cohort 1- Class of 2022- 85%
- Cohort 2- Class of 2023- 89%
- Disaggregation:
- Doctor of Occupational Therapy- The threshold of acceptability for this program is set at 80% passage within 12 months of graduation.
- Note: The first cohort of students will graduate in 2025, so no data is available.
- Doctor of Physical Therapy- Ultimate passage rates (regardless of number of times taken) is 85%
- NPTE Overall Passage Rates:
- As students are still in the process of taking this exam, the passage rate data remains incomplete and official results are unavailable.
- Jones School of Law
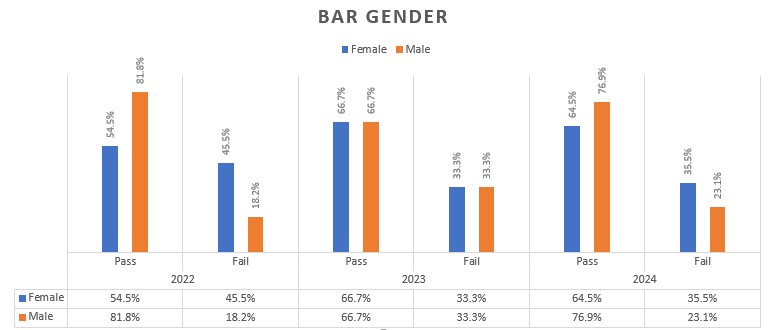
- Juris Doctor- Bar passage rates aligned with overall national averages
- BAR Passage Rates:
- 2022 Total First-time Bar Admission Rate:
- Faulkner: 65.91%
- National Average: 59%
- 2023 Total First-Time Bar Admission Rate:
- Faulkner: 66.67%
- National Average: 58%
- 2024 Total First-Time Bar Admission Rate:
- Faulkner: 71.43%
- National Average: Not readily available at the time of writing
- Disaggregation:
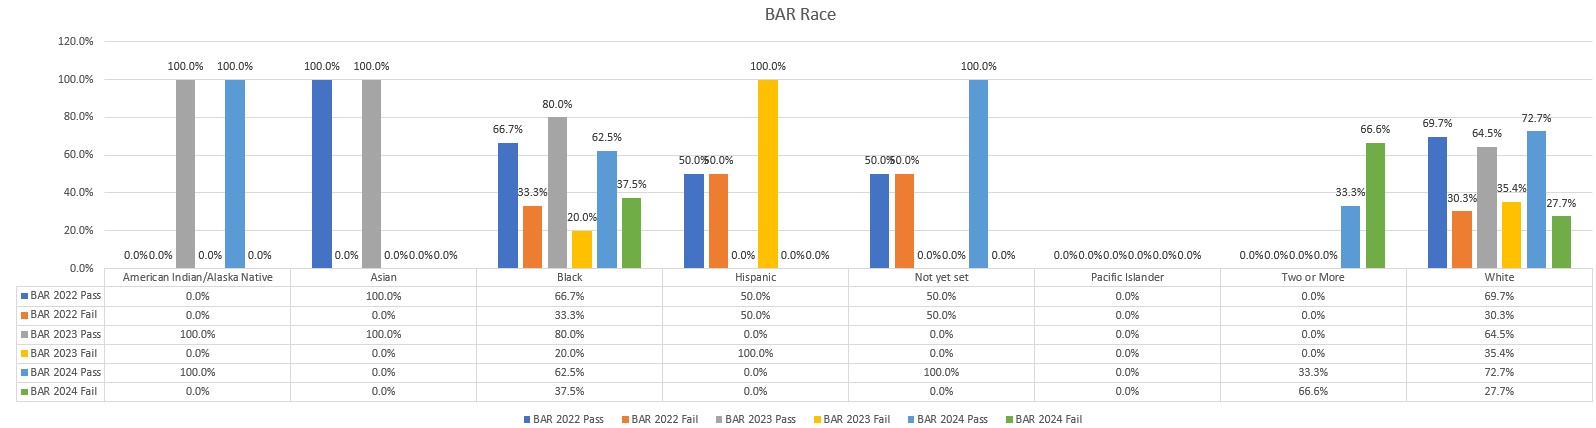
Note: None of the disaggregated data includes Pell/Non-Pell status because these are all graduate programs and none of these students receive Pell Grant funding.
Outcome Results and Discussion of Data Documentation: All programmatic thresholds of acceptability have been developed in conjunction with specialized accrediting bodies for each program and are thus vetted by those bodies. The University accepts whatever thresholds are accepted by the accrediting bodies. Currently, most programs meet these thresholds of acceptability, with many exceeding them. Those programs that have not yet met their thresholds are newer and will hopefully see improvement with time.
Continuous Improvement and Closing the Loop: Based on an analysis of the passage rate data, the University plans to take no further action as an Institution but will continue to work with and encourage programs to maintain high standards and thresholds of acceptability for passage rates and to meet those passage rates if they are not already doing so. Furthermore, as needed, the University is committed to supporting programs and their students when their results fall below the thresholds of acceptability.
5. Graduate Tracking
Explanation and justification of outcome: Graduate tracking is one of the most challenging yet essential metrics for evaluating institutional and student success. This area has garnered significant attention in recent years, leading to the development of several platforms designed to assist institutions in this process. Since colleges and universities often lose contact with students after graduation, tracking their employment outcomes and further academic pursuits can be a complex task.
Until recently, Faulkner relied on an in-house system in which each academic program directly contacted graduates to determine their employment status or continued education. However, Faulkner has since partnered with LiveAlumni to enhance the collection and analysis of graduate data. LiveAlumni aggregates publicly available LinkedIn data (excluding semi-private and private profiles in accordance with legal restrictions) to create a comprehensive database that institutions can use for data aggregation and analysis. This dataset includes information on employment positions, locations, salary ranges, additional education, and other key metrics, enabling institutions to generate reports and assess graduate success (Refer to the Live Alumni Graduate Outcome Reports for more details).
Faulkner has leveraged this platform to develop a series of reports that provide valuable insights into graduate outcomes. The significance of graduate tracking is threefold: it offers a measure of how well students transition into the workforce, assesses the effectiveness of academic programs in equipping graduates with the necessary knowledge, skills, and competencies for their chosen careers, and promotes continuous improvement by identifying areas for enhancement to better support student success in the future.
Student Achievement Outcome and Threshold of Acceptability: Upon partnering with LiveAlumni for graduate tracking, the CAREE Office analyzed key metrics to assess graduate success. Based on this review, four outcomes were established to measure success in graduate tracking:
- Obtaining a position in-field- Graduates who secure in-field positions demonstrate the effective utilization of their degree and its relevance to their career. This outcome has long been a key indicator of success, reflecting that graduates have acquired the knowledge, skills, and dispositions necessary to thrive in their chosen field.
- Obtaining a higher-level degree- Pursuing a higher-level degree is a key measure of success in graduate tracking. Previously, Faulkner only counted higher-level degrees within the graduate field but has since expanded its criteria to include all advanced degrees. This shift recognizes the interdisciplinary nature of many graduate programs and reflects a broader, more inclusive approach to measuring success.
- Obtaining a job in a higher tax bracket- The IRS recognizes seven tax brackets. After reviewing these brackets, Faulkner has established the following metrics to define “obtaining a job in a higher tax bracket”:
- Those in the third bracket have taxable incomes of $47,151 up to $100,525.
- Those in tax brackets four through seven have taxable incomes of $100,526 and higher (Refer to the IRS Tax Rates and Brackets for a complete list of the brackets and additional information).
- Obtaining a C-level position- C-level positions are the highest-ranking roles within an organization, typically beginning with "Chief." Executives in these positions oversee key operations and are responsible for primary decision-making. The titles most commonly associated with C-Level and included in this metric are:
- Chief Executive Officer (CEO)
- Chief Financial Officer (CFO)
- Chief Operating Officer (COO)
- Chief Marketing Officer (CMO)
- Chief Technology Officer (CTO)
- Chief Information Officer (CIO)
- Chief Human Officer (CHO)
- Chief Naval Officer (CNO)
- Chief Product Officer (CPO)
- Chief Human Resources Officer (CHRO)
- Chief Commercial Officer (CCO)
- President
Outcome Results and Discussion of Data Documentation: The Institution sampled 25 years of alumni data from Live Alumni to obtain the outcome results. As a reminder, Live Alumni cannot capture Semi-Private and Private data from LinkedIn. However, even within those constraints, thousands of alumni were captured, and the sampled data was disaggregated to align with the aforementioned outcomes.
Of the students tracked, the population was disaggregated as follows:
Sample Population Disaggregated
Disaggregation by Gender
![]()
Disaggregation by Ethnicity
![]()
Disaggregation by Race
![]()
Disaggregation by Pell/Non-Pell Status
![]()
Data Based on Outcomes
- Obtaining a position in-field- Of the sampled population, 73.6% obtained jobs in field while 26.4% did not obtain jobs in field.
- Obtaining a higher-level degree- Of the sampled population, 35% obtained a higher-level degree and 64.9% did not.
- Obtaining a job in a higher tax bracket- The breakdown of tax brackets is as follows:
![]()
- Obtaining a C-level position- Of the sample population, 4% obtained C-level positions. While this number may seem small to some, this number is not insignificant when considering the smaller percentage of jobs available at this level.
Continuous Improvement and Closing the Loop: Disaggregating this data in this manner is fairly new to Faulkner, as previous graduate tracking has focused solely on in-field job placement or higher education. The Institution believes this data is much more meaningful to current and future students, however. It will continue to review and further disaggregate this data, refining the process for future use.
Disaggregation of Data
In alignment with the requirements of Standard 8.1, all student achievement data has been disaggregated by gender, race, ethnicity, and Pell/Non-Pell status. Institutions increasingly recognize disparities among specific student populations, with these four categories particularly significant. Disaggregating student achievement data in this manner allows students within these populations to assess their potential success rates while enabling the Institution to identify and support those who may require additional resources. The discussion section of each outcome provides a detailed narrative of the data for each population, and the continuous improvement section outlines strategic efforts to address disparities.
Even before disaggregated data analysis was implemented under this standard, Faulkner University had acknowledged these disparities and proactively initiated measures to mitigate them. In 2021, the University was awarded two Predominantly Black Institutions (PBI) grants to enhance the academic success of Black students and those from lower socioeconomic backgrounds. The University’s Quality Enhancement Plan (QEP) was also developed to provide targeted academic support strategies that benefit these students. The Institution will continue to analyze this data in greater depth to identify and implement further strategies for closing achievement gaps.